TABLE OF CONTENTS
Description
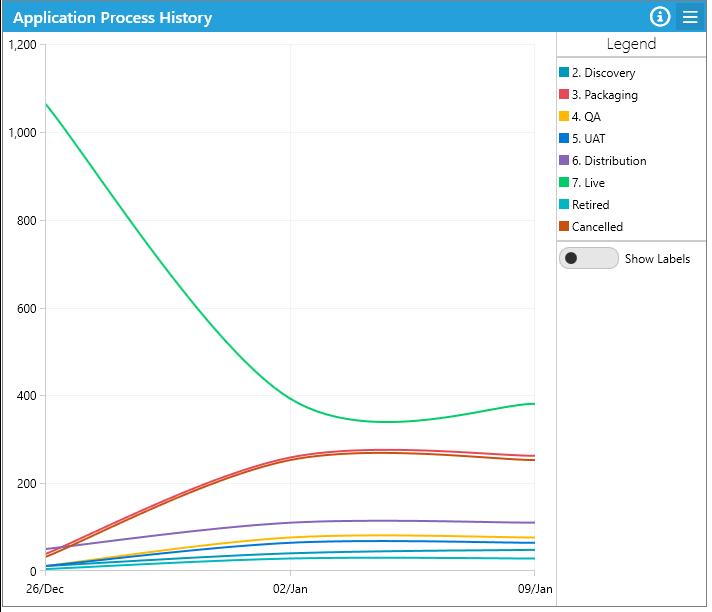
The Process History chart displays the historical movement of Apps, Users, Devices, and other items through processes over time. For example, the number of Apps in the Identified Queue may decrease weekly, while the number of Apps in the Complete queue may increase.
Variants
All Processes
- Displays all Processes within the module.
Specific Processes
- Displays a subset of Processes within the module.
- See the Dashboard Examples article for further information on this variant.
Adv. Widget Arguments
- Look Back Weeks: Allows the number of weeks to look back in time to be set. For example, setting this to '12' will show the last 12 weeks of Process history.
Supported Modules
- Applications
- User Migrations
- Devices
- Mailboxes
- Bespoke Module
- Deployment Units
- Defects
- Tasks
Supported Chart Types
- Line Charts
- Spline Charts
Further Support
For additional assistance, please visit the ManagementStudio Service Desk to search the knowledge base or create a new support ticket.
Was this article helpful?
That’s Great!
Thank you for your feedback
Sorry! We couldn't be helpful
Thank you for your feedback
Feedback sent
We appreciate your effort and will try to fix the article